
The starting point for any valuation is not your top line but what flows to the bottom. Revenue tells a buyer how large the business is. Earnings tell them what they're actually buying.
In small business acquisitions, the two most commonly used earnings metrics are SDE (Seller's Discretionary Earnings) and EBITDA (Earnings Before Interest, Taxes, Depreciation, and Amortization). For businesses under $2M in revenue, SDE is typically used. For businesses in the $2M–$6M range, buyers increasingly use EBITDA, because at that scale, they expect to replace the owner's working role with hired management.
Understanding which metric applies to your business, and calculating it accurately, is the first and most important step to knowing what you're worth.
Owners who anchor their asking price to revenue multiples - "we should sell for 1x revenue" - without understanding their earnings profile will either overprice themselves out of serious conversations, or underprice and leave significant money on the table.

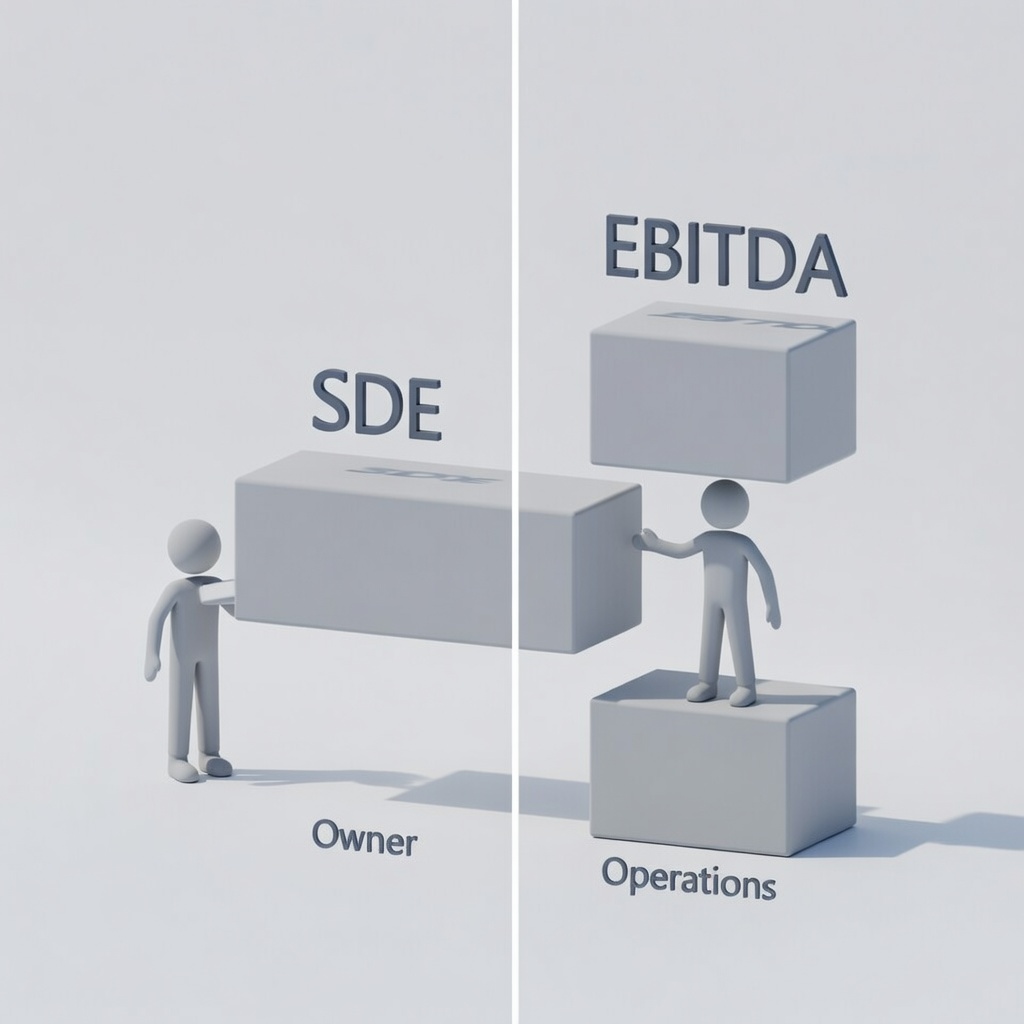
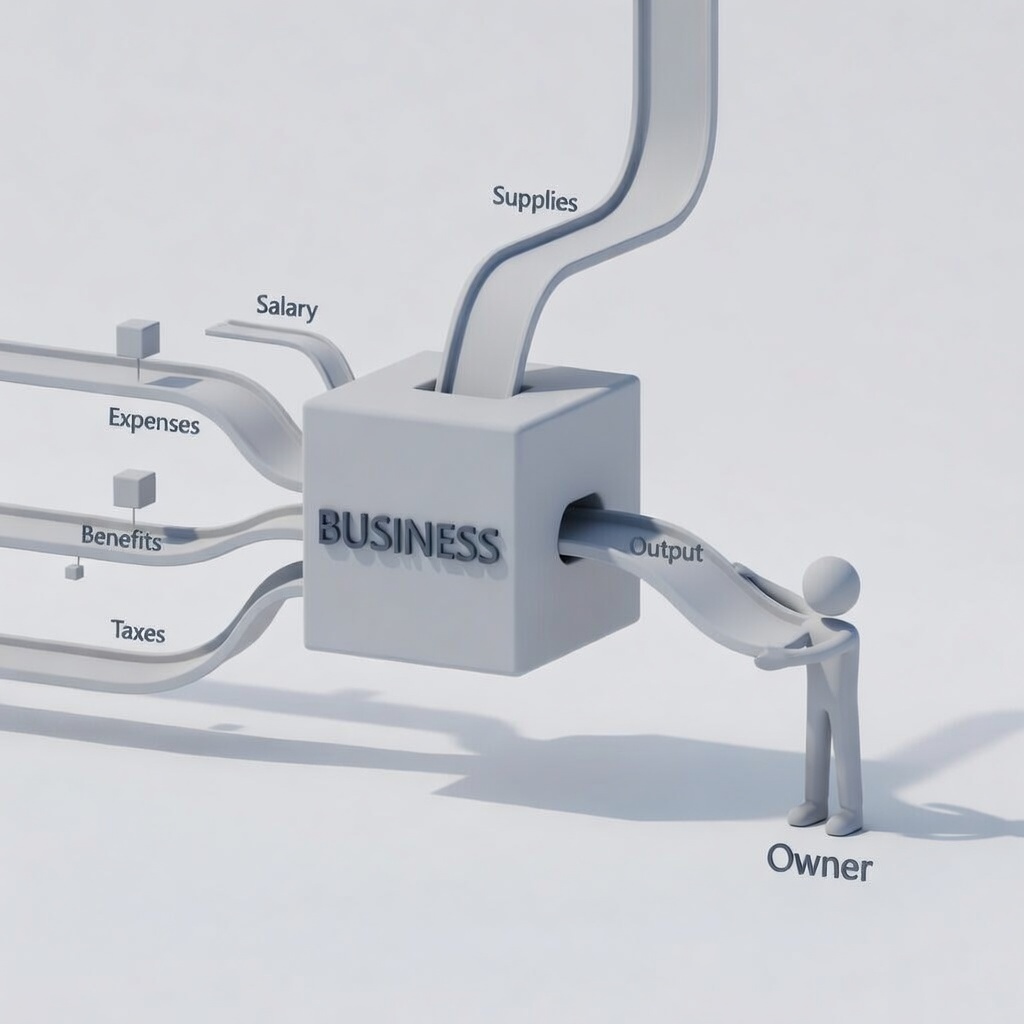
SDE starts with net income and adds back the owner's total compensation, personal expenses run through the business, depreciation, amortization, interest, and genuine one-time items. It represents the total economic benefit to a single working owner and is the right metric when the buyer plans to work in the business themselves.
EBITDA is a cleaner metric that assumes the owner's role is replaced by a hired manager at market salary. It's what the business earns as a standalone operation. Buyers at the $2M+ level use EBITDA because they need to understand what the business earns independent of any one person.
Knowing which one applies, and having a clean, defensible calculation ready, puts you in a far stronger position than arriving at the table with a number you can't back up.
Add-backs that stretch credibility. Every adjustment gets scrutinized. Personal expenses, salaries for family members who don't meaningfully work in the business, and "one-time" items that appear every year will be challenged - and challenged hard - by experienced buyers and their accountants.
Valuation multiples vary by industry, business size, revenue quality, and risk profile. The table below shows typical ranges for businesses in the $2M–$6M revenue range, based on current transaction data.
| Industry | Basis | Typical multiple |
|---|---|---|
| Fire & Life Safety Services | SDE | 2.5 – 4.0x |
| Inspection & Compliance Services | SDE | 2.5 – 3.5x |
| Commercial HVAC & Mechanical | SDE | 2.5 – 3.5x |
| Residential HVAC Services | SDE | 2.0 – 3.0x |
| Environmental & Industrial Services | SDE | 2.5 – 3.5x |
| Electrical Services | SDE | 2.0 – 3.0x |
| Niche B2B Distribution | SDE | 2.0 – 3.0x |
| Light Manufacturing | SDE | 2.0 – 3.0x |
| General Commercial Services | SDE | 1.5 – 2.5x |
Sources: IBBA Market Pulse Report Q3 2024; BizBuySell Insight Report 2024; Pepperdine Private Capital Markets Project 2024. Ranges reflect SDE-based transactions in the $1.5M–$6M revenue segment. Actual multiples depend on revenue quality, customer concentration, management depth, and growth trajectory.
Comparisons to public company multiples or PE-backed platform acquisitions. Those transactions reflect different scale, strategic premiums, and risk profiles. A $3M revenue business and a $300M platform are valued by entirely different logic.
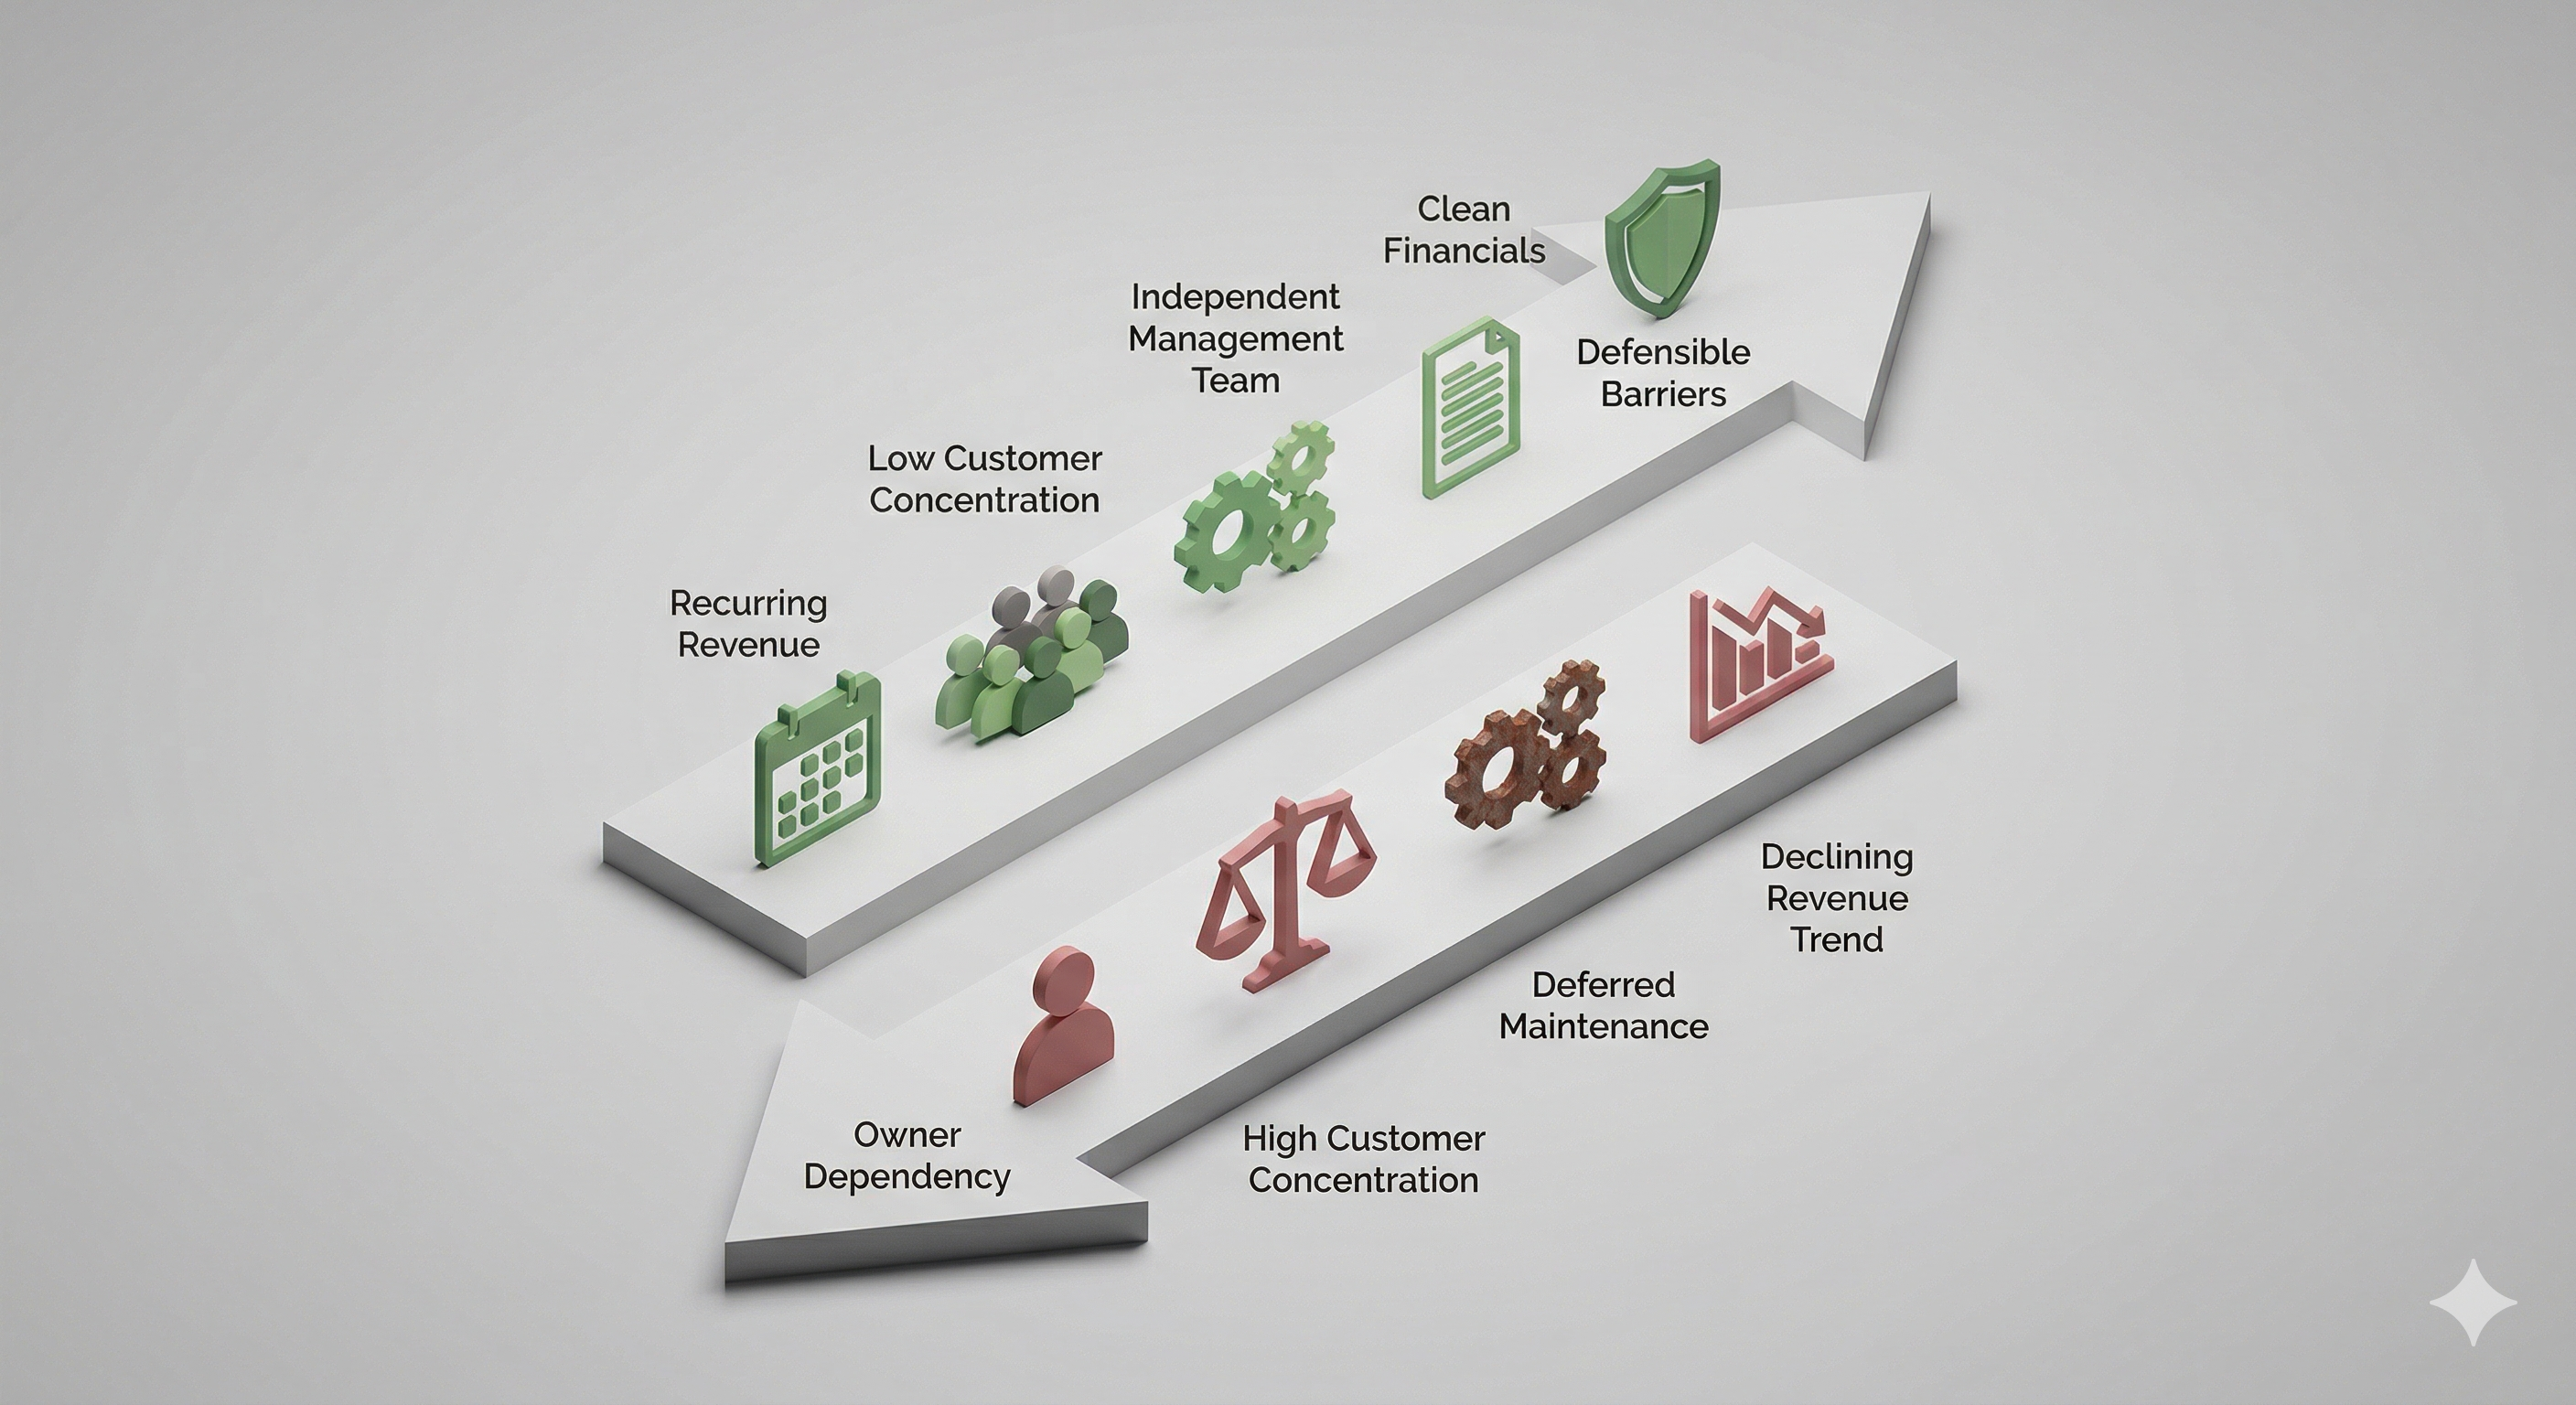
Within any range, the multiple you achieve depends on specific characteristics of your business. These are the factors buyers weigh most heavily.
- Recurring or contract-based revenue: annual inspection agreements, maintenance contracts, service subscriptions
- Low customer concentration: no single customer exceeding 15–20% of revenue
- Management team that operates without the owner
- Clean, consistent financials: reviewed or audited preferred
- Defensible technical, geographic, or regulatory barriers to entry
- Heavy owner dependency in operations, sales, or customer relationships
- Customer concentration: one or two clients representing a large share of revenue
- Deferred maintenance, aging equipment, or capital expenditure backlog
- Declining revenue trend, even if current earnings are acceptable
A business that checks every negative box but is priced at the top of its range. This is the single most common reason deals fall through after a letter of intent is signed: the gap between asking price and justified price becomes visible during due diligence.
The businesses that sell at the top of their range share one thing: they prepared before going to market.
That means building a management team that can run operations without the owner. Documenting processes so that institutional knowledge isn't locked in one person's head. Reducing customer concentration. Investing in deferred maintenance. And producing clean, consistent financial statements year over year.
Each of these is not just an operational improvement; it is a direct valuation improvement. Every point of customer concentration you reduce, every manager you develop, every year of clean financials you add is worth real money at closing.
If you are closer to selling and don't have years to prepare, focus on what you can still control: organize your financials, prepare a clear and defensible add-back schedule, and enter the process with realistic expectations grounded in actual market data, not in what you need the number to be.
Waiting until you are burned out to sell. Buyers can tell when an owner has mentally checked out, and it shows in the business performance, the team's morale, and the quality of information provided during due diligence. The best time to sell is when the business is performing well and you still have energy for a proper transition.